Contents
About CoDNaS
Implementation
An example of application
Conditions associated with conformational change
About CoDNaS
CoDNaS database is a collection of redundant crystallographic structures for a given protein extensively linked with structural, biological and physicochemical information. Several proteins deposited in PDB database have been crystallized in different conditions (for example with and without the presence of a given ligand, in different oligomeric states, with or without the presence of post-translational modifications, etc). It is well established that the native state of a protein is better represented as a collection of different structural conformers in a dynamic equilibrium (Kumar et al., 2000)(James & Tawfik, 2003). It has been shown, that the structures obtained under different conditions are snapshots of protein dynamism and then are putative conformers(Zoete, Michielin, & Karplus, 2002)(Best, Lindorff-Larsen, DePristo, & Vendruscolo, 2006).
Implementation
Using the BlastClust application on Protein Data Bank Database (PDB) (Berman, 2000) we obtained all the different structures deposited for a given protein. Using these files, we computed different structural similarity measures (MAMMOTH (Ortiz et al., 2002), ProFit (McLachlan, 1982) and TM-score (Zhang and Skolnick, 2004)) for all the structures for each protein retrieved and we registered the maximum RMSD as a measure of its conformational diversity. For each structure we obtained the different factors involved in the structure estimation such as presence of ligands, mutations, post-translational modifications, changes in oligomeric state, pH, loops regions and temperature. According to the conformational selection theory these factors could be used to study conformational changes and correlate them with biological information. Proteins were also linked with several databases as UniProt (Jain et al., 2009), Gene Ontology (Ashburner et al., 2000), EC number (Kotera et al., 2004), CATH (Greene et al., 2007), SIFTS (Velankar et al., 2005), MobiDB (Di Domenico et al., 2012) in order to obtain a broad spectrum of biological and physical-chemical information such as taxonomy, source organism, protein function, degree of disorder, structural class, structural estimation method among others. Structures (putative conformers) for a given protein were clustered using two algorithms (hierarchical clustering and affinity propagation clustering) and besides global similarity structural measures, per position RMSD were also derived. Furthermore, different parameters characterizing conformational change (disorder, loopy residues content and solvent exposed area) were also derived. The web application server is implemented on HTML, PHP and Java languages, connected with a MySQL database.
An example
The protein Troponin C from Gallus gallus, a protein contained in the troponin complex and involved in muscle contraction. It shows 149 conformers coming from RX and NMR different experiments (PDB codes, 1AVS, 1ZAC, 1TNQ, 1TNP, 1SKT and 1BLQ). It is important to note that each model coming from NMR experiments is taken as individual conformers. The minimum RMSD obtained after the comparison of these structures is 0.578 [Å] while the maximum is 3.31 [Å]. For example, the pair of structures with PDB codes 1SKT and 1TNQ that in this particular case involves a pair of conformers coming from NMR structures. The difference between these structures is a consequence of presence of Ca++ ion in the structure 1TNQ and the apoform in the structure 1SKT. Assuming the pre-equilibrium hypothesis (Ma, Shatsky, Wolfson, & Nussinov, 2002), the binding of ligand(in this case the calcium ion) shifts the conformational equilibrium towards the conformer showing a higher binding affinity to calcium ion. This produces the exposure of an extensive hydrophobic patch which triggers skeletal muscle contraction (Gagne, Tsuda, Li, Smillie, & Sykes, 1995).
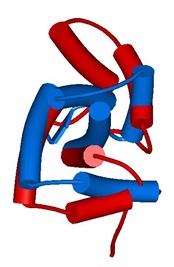
Figure 1. Structural aligment of protein Troponin C from Gallus gallus.
The figure 1 shows the structural alignment between two putative conformers of the troponin C, 1SKT and 1TNQ, the apoform and the calcium binding form of the protein. The structural comparison shows a RMSD of 7.18 A. Other measures of structural change could also be found in CoDNaS (for example TM value, GDT-HA, GDT-TS). Additional information about conformational extension of this protein could also be found in CoDNaS. For example we can visualize the positions involve in the conformational change in the figure 2 where we plot the RMSD per position:
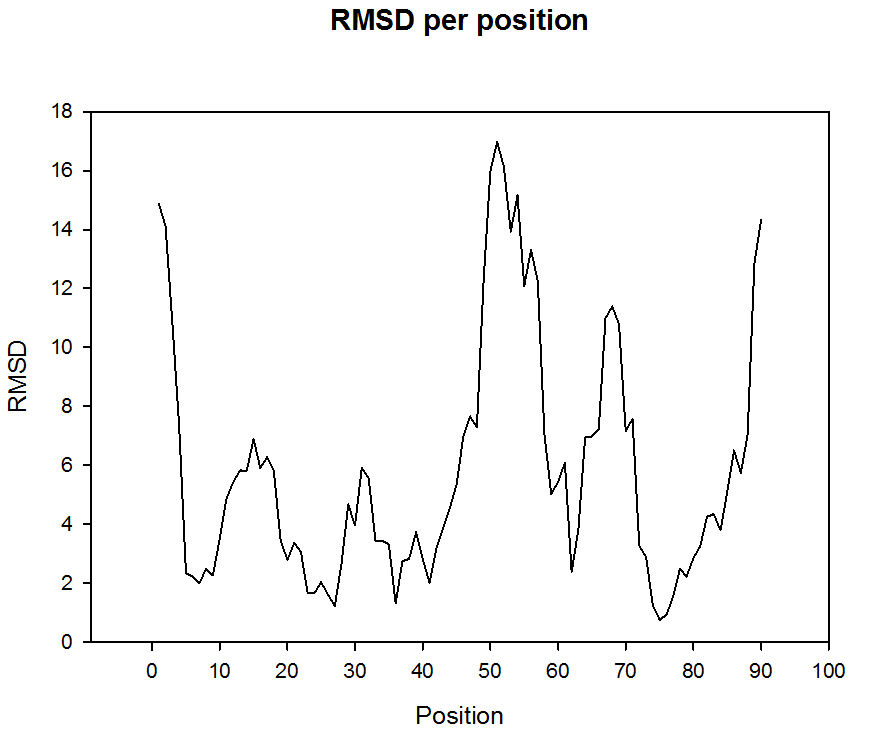
Figure 2. RMSD by position of protein troponin C.
Or the plot involving the Z-scores (Figure 3) derived from the comparison of the RMSD by position in reference to the RMSD from all the positions for the protein allowing a relative interpretation of the mobility of a given position in reference to the rest of the positions:
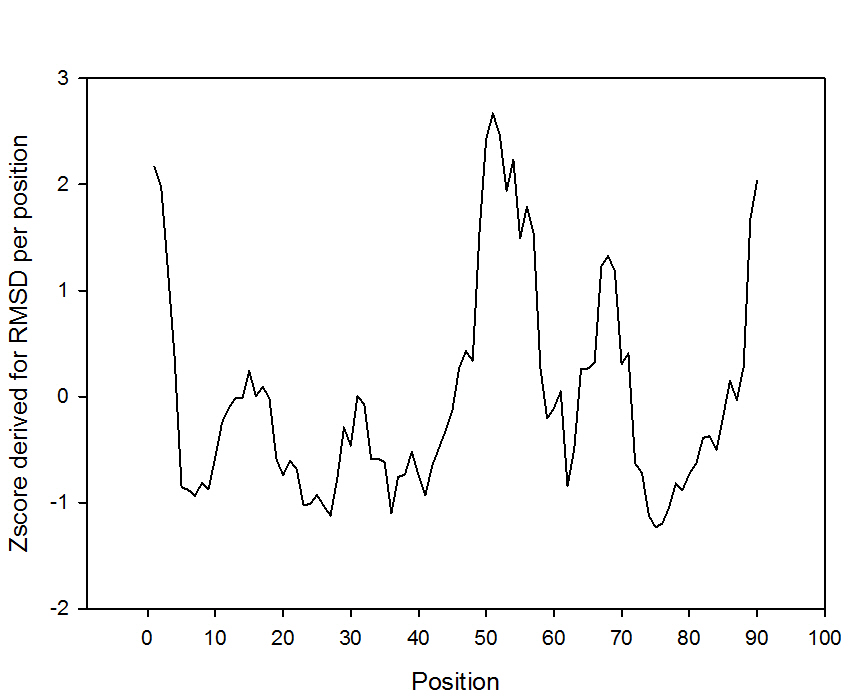
Figure 3. Z-score by position of protein troponin C.
Most of the 151 conformers deposited in CoDNaS are structurally very similar showing a minimum RMSD of 0.57 and an average of 4.06. To visualize the structural differences between them we have performed a structural clustering which is show below (Figure 4):
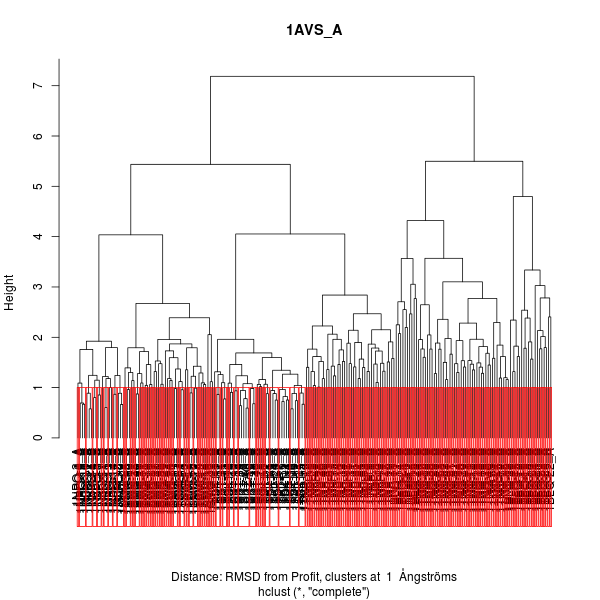
Figure 4. Hierarchical clustering of protein troponin C.
Using this clustering it is possible to see that the higher structural differences between any conformer is about 7, but most of the comparison between the 151 conformers display RMSD values below 1.0.
Conditions associated with conformational change
In the case of troponin the maximum RMSD between the different structures is obtained when the apoform of the protein is compared with the calcium-binding form (in this example PDB codes 1SKT and 1TNQ). However, in the rest of the comparisons involving the 151 conformers which do not display the maximum RMSD, other differences in experiments conditions could be involved. For example, the comparison of conformers coming from structures 1BLQ (model 11) and 1SKT (model 11) give an RMSD of 5.068A. This structural difference could be associated with a difference in the number of loop or coil regions in each structure. In fact, the difference in these regions is about 20%. This could be originated in the high mobility of the protein in solution or by the increase in the temperature between these two experiments (the difference between 1BLQ and 1SKT is 26 kelvin).
Then, different factors associated with the conditions in which the experiments were performed could be associated in some cases with the structural differences observed. The full list of conditions considered in CoDNaS and which could be associated with structural changes between different structures for the same protein is listed below:
Several proteins in CoDNaS are associated with structures obtained under variations in the mentioned conditions. For example the structures 1BLQ and 1AVS of troponin C have temperature and pH differences making difficult to establish a single factor associated with conformational differences. However, other comparisons between conformers are associated with only one factor as we mentioned above in the presence of a ligand.
In order to associate a given condition with the presence of conformational diversity we studied how the conformational diversity is associated with different factors such as protein length, number of available conformers, RX resolution, number of contacts between molecules in crystals, influence of space group type and taxonomy among others. Using statistical tests we did not find any statistically relevant correlation between RMSD and different parameters or conditions listed below:
| Experimental Method | Number of proteins | Conformers per protein (average) | Pearson correlation coefficient | P-value |
|---|---|---|---|---|
| DRX | 16,588 | 3.84 | 0.084 | 3.508E-14 |
| NMR | 992 | 31.89 | 0.143 | 1.16E-04 |
| Pearson correlation coefficient | P-value |
|---|---|
| 0.0336 | 0.0067 |
To estimate the contacts between protein chain in the assymetric unit and molecules in other the unit cells, we used the program UCSF Chimera. We estimated the number of crystallographic contacts at 4.5 Å of distance in both conformers of the maximum pair of RMSD. We averaged the number of contacts and we studied the correlation with the maximum RMSD.
| Spearman's correlation coefficient |
|---|
| 0.048 |
To evaluate if the difference in the crystallographic symmetry between conformers could influence the presence of conformational diversity, we studied the distribution of RMSD in a set of proteins showing different number of conformers all with the same symmetry. This distribution was compared against a set with the same number of proteins with variations in the symmetry among the conformers. Using a Kolmogorov-Smirnov test (D = 0.2899, p-value = 0.04105) we found that the distributions are the same.
We used a subset of maximum pair of proteins in which the conformers of the maximum pair of RMSD has been crystallised at cryogenic temperature (100 K) and another subset with maximum pairs of RMSD obtained at room temperature. Both distributions are shown below and are remarkably statistically similar.
Some examples of the distributions obtained showing no correlation with RMSD are shown below.
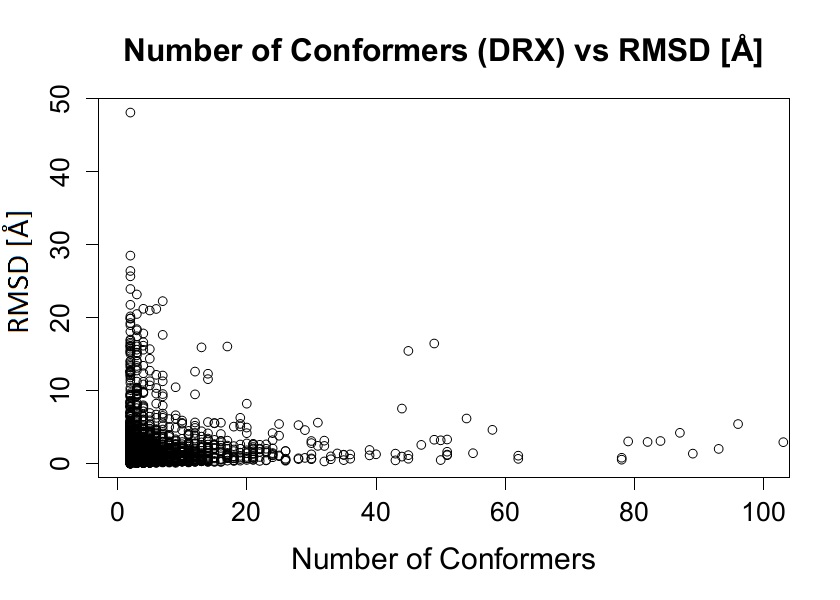
Figure 5. RMSD vs Number of conformers (DRX)
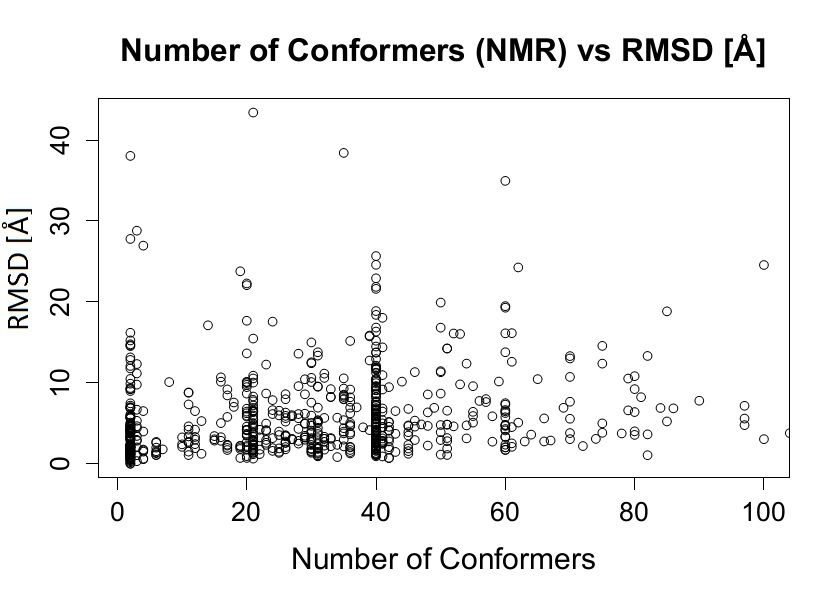
Figure 6. RMSD vs Number of conformers (NMR)
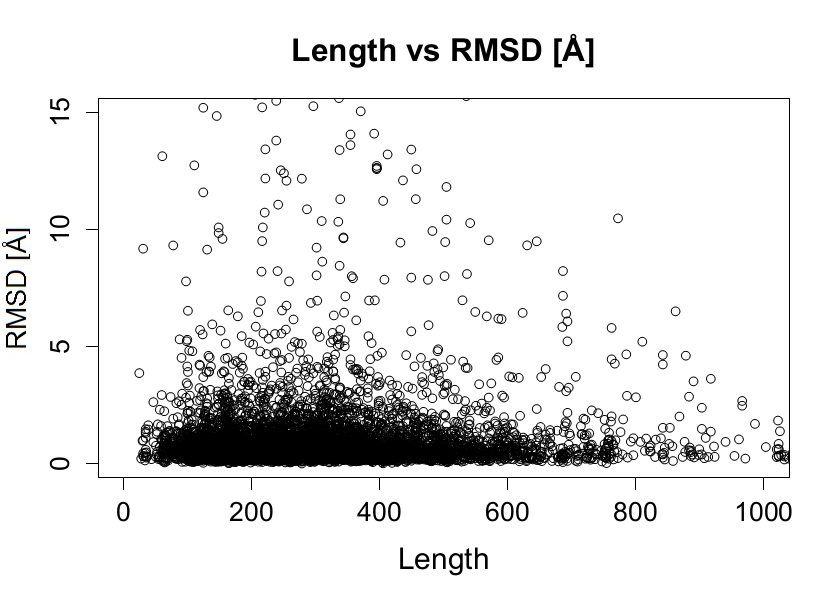
Figure 7. RMSD vs Length
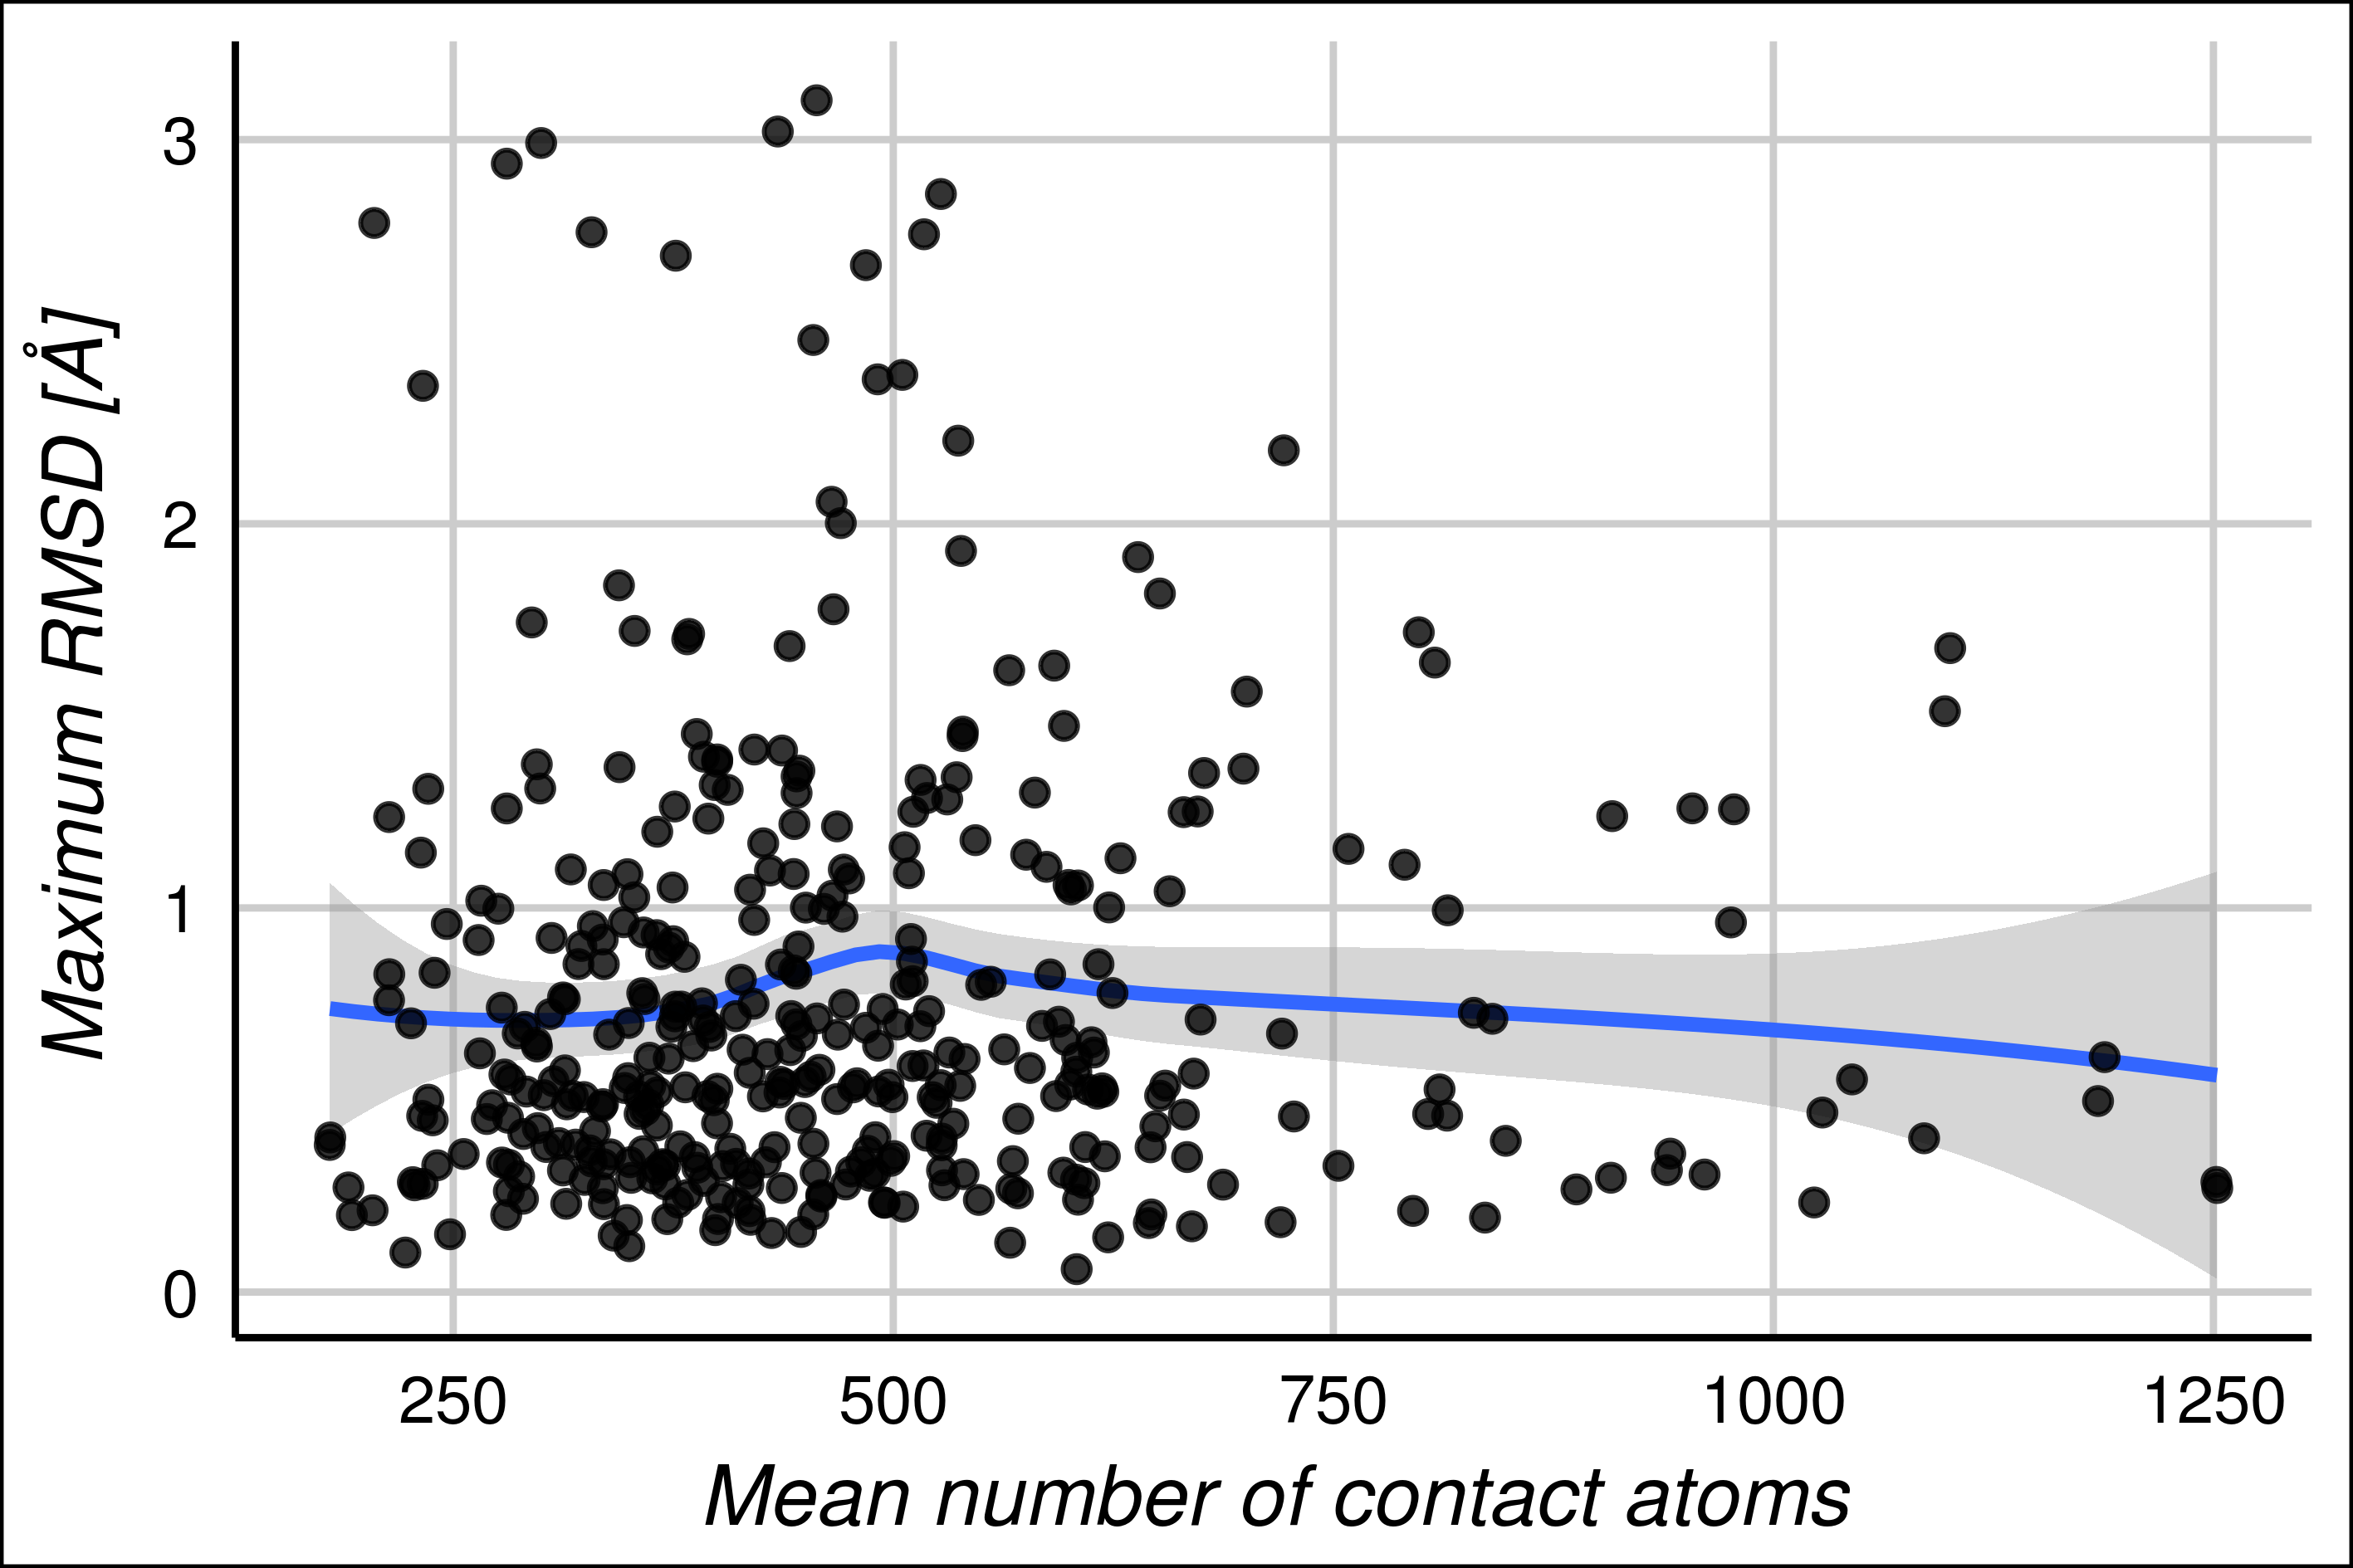
Figure 8. RMSD vs Average number of crystal contacts
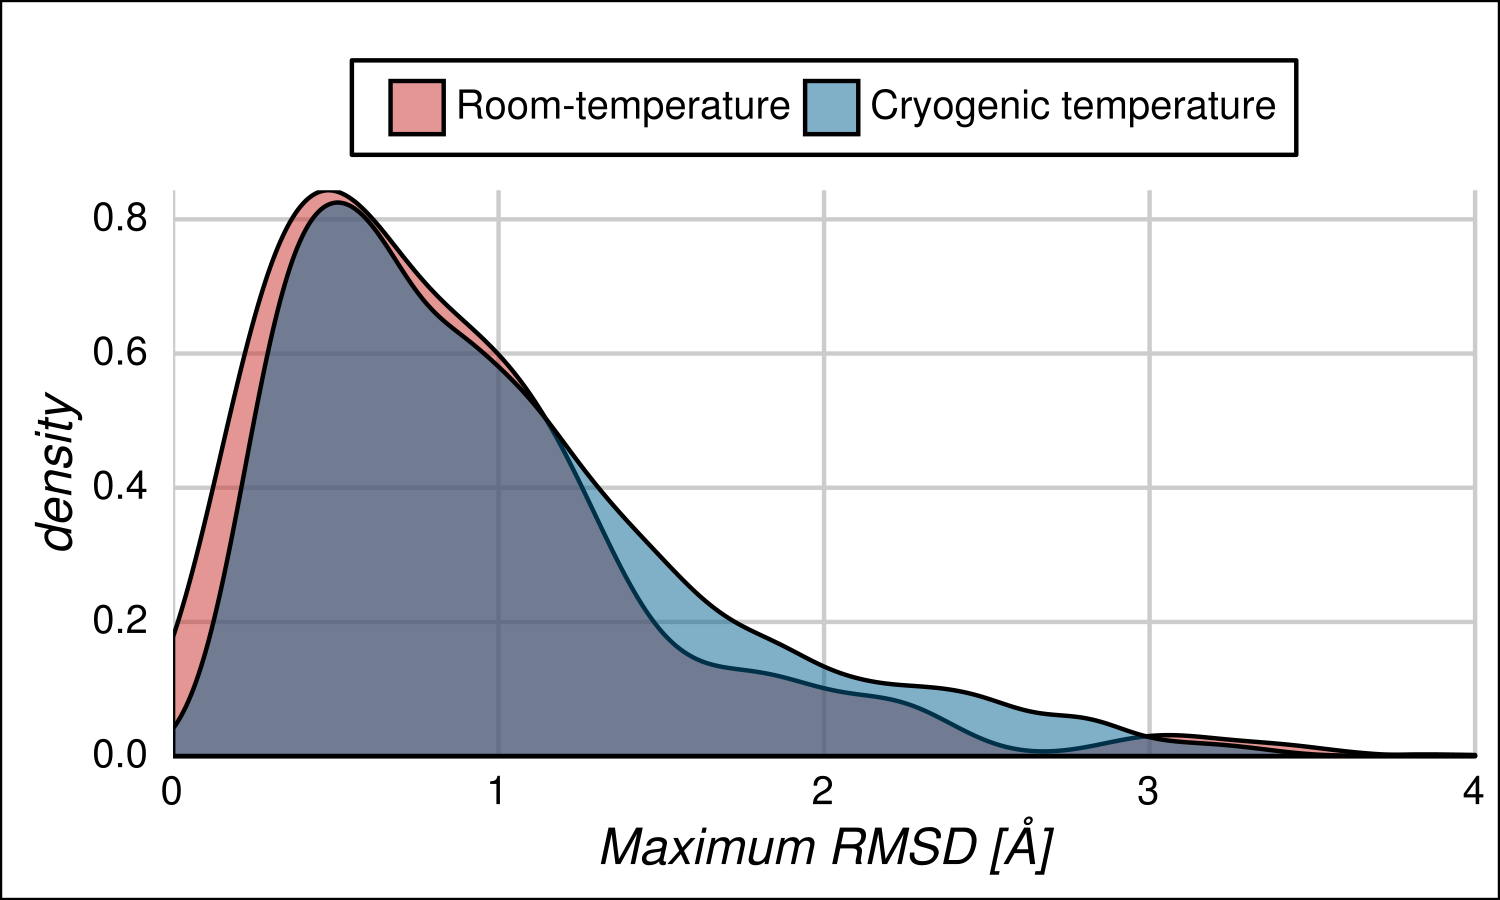
Figure 9. Distributions of pair of conformers obtained at different temperature
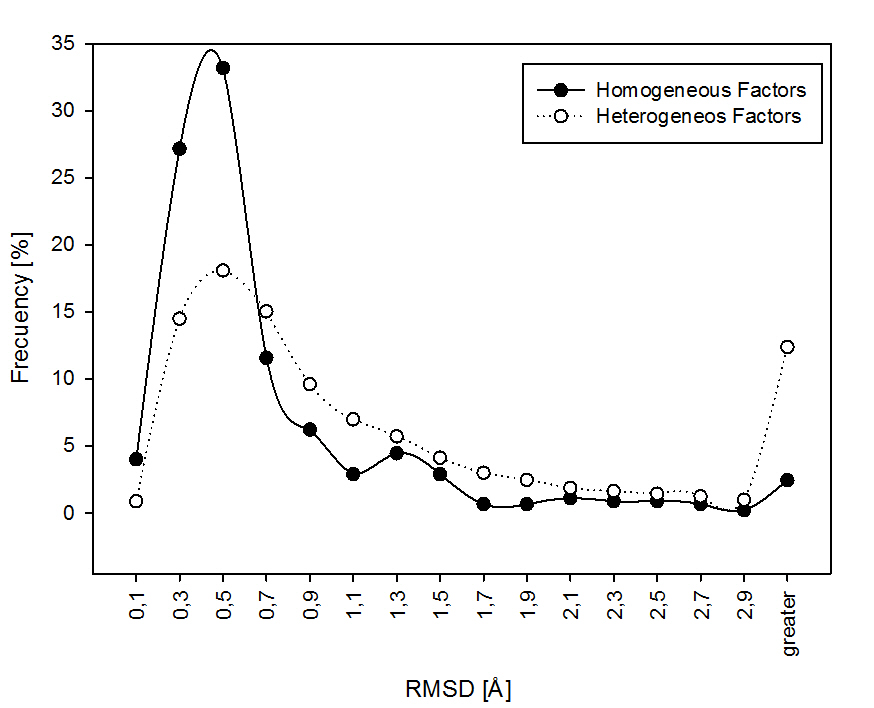
To further explore how the variation in the conditions above mentioned influence conformational diversity, we explore the conformational diversity in proteins showing none variation of the above factors among their correspondingly structures. We call this group of proteins "homogeneous" because taking into account the factors associated with the variation of the experiments to obtain the structures, "homogeneous" proteins shown no variation in the listed conditions among different experiments. When "homogeneous" proteins are compared with "heterogeneous" proteins (those with a variation in a given condition listed above (for example presence of ligands) the distributions are statistically different. The two distributions were analyzed with the Kolmorogov-Smirnov test, we obtained a significative P-value of 7.206e-08. This mean that the two samples doesn't came from the same distribution.